# New Relic Integration
New Relic is a full-stack observability platform that helps you monitor application performance, infrastructure health, browser experience, and more. It provides real-time insights with customizable alerting through its Alerts & AI system.
### Overview
This guide walks you through integrating New Relic with our alert management platform. New Relic delivers alert notifications through its **Workflow** system: when an alert condition is violated, New Relic creates an **Issue**, and the configured Workflow sends a webhook payload to our platform. When the issue is closed (manually or automatically), a separate **CLOSED** payload is sent for recovery.
### Integration Flow
1. New Relic monitors your infrastructure, applications, and services through installed agents and integrations.
2. When a metric violates a configured **Alert Condition** threshold, New Relic opens an **Incident** and groups it into an **Issue**.
3. The **Workflow** evaluates its filter criteria and sends an HTTP POST webhook payload to the configured **Destination** (our platform endpoint).
4. When the issue is resolved or manually closed, the Workflow sends a **CLOSED** payload to the same endpoint for recovery.
***
### Webhook Payload Schema
New Relic sends a customizable JSON payload via Workflows. The default payload template includes the following fields:
| Field | Type | Required | Description |
| ------------------- | ------- | -------- | ----------------------------------------------------------------- |
| id | string | Yes | Unique identifier for the issue |
| issueUrl | string | Yes | Direct link to the issue in New Relic |
| title | string | Yes | Human-readable description of the alert condition violation |
| priority | string | Yes | Issue priority: `CRITICAL`, `HIGH`, `MEDIUM`, `LOW`, `WARNING` |
| impactedEntities | array | Yes | List of affected entity names (e.g., hostname) |
| totalIncidents | number | Yes | Number of incidents grouped into this issue |
| state | string | Yes | Issue state: `CREATED`, `ACTIVATED`, `ACKNOWLEDGED`, `CLOSED` |
| trigger | string | Yes | What triggered this notification: `INCIDENT_ADDED`, `USER_ACTION` |
| isCorrelated | boolean | No | Whether the issue was correlated with other issues |
| createdAt | number | Yes | Unix timestamp (ms) when the issue was created |
| updatedAt | number | Yes | Unix timestamp (ms) when the issue was last updated |
| sources | array | Yes | Source of the alert (e.g., `["newrelic"]`) |
| alertPolicyNames | array | Yes | List of alert policy names associated with this issue |
| alertConditionNames | array | Yes | List of alert condition names that triggered this issue |
| workflowName | string | Yes | Name of the workflow that sent this notification |
***
### State / Status Mapping
| New Relic State | Platform Status | Description |
| --------------- | --------------- | ------------------------------------------------- |
| CREATED | PROBLEM | Issue just created, first incident added |
| ACTIVATED | PROBLEM | Issue is active with ongoing incidents |
| ACKNOWLEDGED | ACKNOWLEDGED | Issue has been acknowledged by a team member |
| CLOSED | RECOVERY | Issue resolved — either manually or automatically |
### Priority Mapping
| New Relic Priority | Platform Severity |
| ------------------ | ----------------- |
| CRITICAL | Critical |
| HIGH | High |
| MEDIUM | Medium |
| LOW | Low |
| WARNING | Warning |
***
### Alert Payload Examples
#### Raised (CREATED)
This payload is sent when a new issue is created from a threshold violation. The `state` field is `CREATED` and the `trigger` is `INCIDENT_ADDED`.
— CREATED payload received at webhook.site
```json
{
"id": "63d9ded1-4a02-46de-bcd5-e8305d743164",
"issueUrl": "https://radar-api.service.newrelic.com/accounts/1/issues/0ea2df1c-adab-45d2-aae0-042b609d2322?notifier=WEBHOOK",
"title": "prod-web-server-01 query result is > 1.0 for 1 minutes on 'High CPU Usage'",
"priority": "CRITICAL",
"impactedEntities": [
"prod-web-server-01"
],
"totalIncidents": 1,
"state": "CREATED",
"trigger": "INCIDENT_ADDED",
"isCorrelated": false,
"createdAt": 1770993830980,
"updatedAt": 1770993830980,
"sources": ["newrelic"],
"alertPolicyNames": ["Test Infrastructure Policy"],
"alertConditionNames": ["High CPU Usage"],
"workflowName": "OnCall Webhook Workflow"
}
```
#### Cleared (CLOSED)
This payload is sent when the issue is closed. The `state` field is `CLOSED` and the `trigger` indicates what caused the closure (e.g., `USER_ACTION` for manual close).
— CLOSED payload received at webhook.site
```json
{
"id": "63d9ded1-4a02-46de-bcd5-e8305d743164",
"issueUrl": "https://radar-api.service.newrelic.com/accounts/1/issues/0ea2df1c-adab-45d2-aae0-042b609d2322?notifier=WEBHOOK",
"title": "prod-web-server-01 query result is > 1.0 for 1 minutes on 'High CPU Usage'",
"priority": "CRITICAL",
"impactedEntities": [
"prod-web-server-01"
],
"totalIncidents": "1",
"state": "CLOSED",
"trigger": "USER_ACTION",
"isCorrelated": "false",
"createdAt": 1770993830980,
"updatedAt": 1770996003468,
"sources": ["newrelic"],
"alertPolicyNames": ["Test Infrastructure Policy"],
"alertConditionNames": ["High CPU Usage"],
"workflowName": "OnCall Webhook Workflow"
}
```
***
### Installation & Configuration
#### Step 1: Create an Alert Source in the Platform
1. Log in to the alert management platform.
2. Navigate to **Integrations** → **Add Integration**.
3. Select **New Relic** as the provider.
4. Name the integration (e.g., `Production New Relic Alerts`).
5. Save and copy the generated **Webhook URL** and **Token**.
#### Step 2: Create a Webhook Destination in New Relic
1. Log in to your **New Relic** account.
2. Navigate to **Alerts** → **Destinations** (under ENRICH & NOTIFY in the left sidebar).
— Destinations page (empty, showing available destination types)
3. Click on **Webhook** from the "Add a destination" section.
4. Configure the webhook destination:
* **Webhook name**: Enter a descriptive name (e.g., `OnCall Platform`)
* **Endpoint URL**: Paste your platform webhook URL
* **Authorization**: Select 'custom header' and fill the key blank with "x-itoc360-token" then paste your source token through value blank.
5. Click **Save destination**.
— Add destination form with webhook name and endpoint URL
6. The destination will now appear in the Destinations list.
— Destination created and visible in the list
#### Step 3: Install the New Relic Infrastructure Agent
To generate real metrics for alerting, install the New Relic Infrastructure Agent on your host.
1. Navigate to **Integrations & Agents** in the left sidebar.
2. Search for your operating system (e.g., `macOS`, `Linux`, `Windows`).
— Integrations & Agents search
3. Select your OS and follow the guided installation:
* **Step 1**: Create or use an existing **User Key**.
— User key creation step
* **Step 2**: Copy and run the install command on your host.
— Infrastructure agent install command
* **Step 3**: Wait for the connection test to complete.
— Agent connected successfully
4. After installation, verify your host appears in **All Entities** with live metrics (CPU, Memory, Storage, Network).
— All Entities page showing the host with live metrics
#### Step 4: Create an Alert Condition
1. Navigate to **Alerts** → **Alert Conditions** or click **Create alert condition**.
2. Select **Write your own query** (NRQL mode).
3. Enter a NRQL query to monitor a metric. For example, to monitor CPU usage:
```sql
SELECT average(cpuPercent) FROM SystemSample WHERE hostname LIKE '%YourHostname%'
```
— NRQL query entered in the condition builder
4. Click **Next** to set thresholds.
5. Configure the condition threshold:
* **Threshold type**: Static
* **Severity level**: Critical
* **When a query returns a value**: above `1` for at least `1` minute
— Threshold configuration (Static, Critical, above 1 for 1 minute)
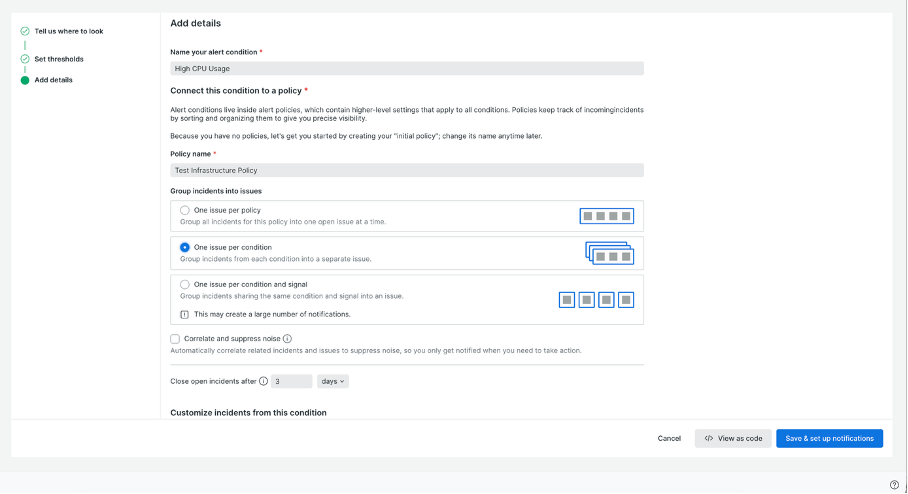
6. Click **Next** to add details.
7. Configure the condition details:
* **Name your alert condition**: `High CPU Usage`
* **Policy name**: `Test Infrastructure Policy` (or create a new policy)
* **Group incidents into issues**: Select **One issue per condition**
— Add details page with condition name and policy
8. Click **Save & set up notifications**.
#### Step 5: Create a Workflow
1. Navigate to **Alerts** → **Workflows** (under ENRICH & NOTIFY).
— Workflows page
2. Click **Create your first workflow** (or **Add a workflow** if you already have one).
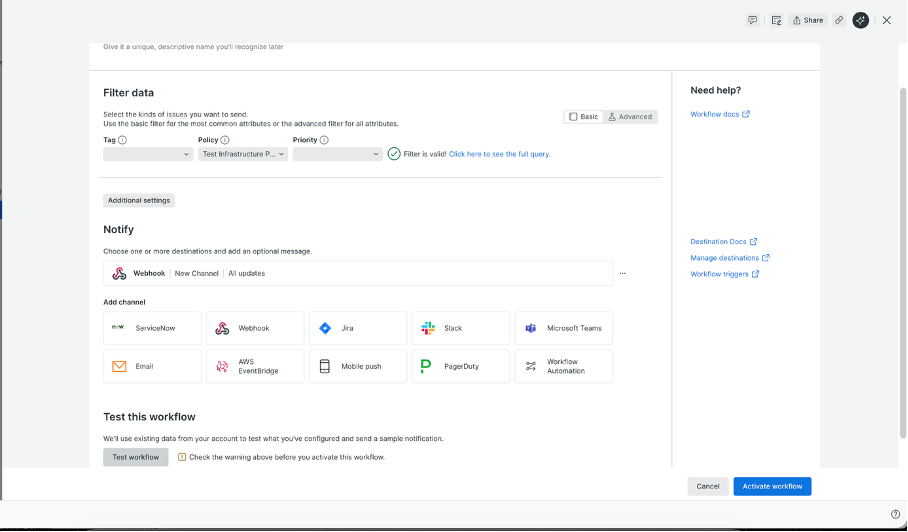
3. Configure the workflow filter:
* **Policy**: Select `Test Infrastructure Policy`
* Verify the filter shows "Filter is valid!"
— Workflow filter configuration with policy selected
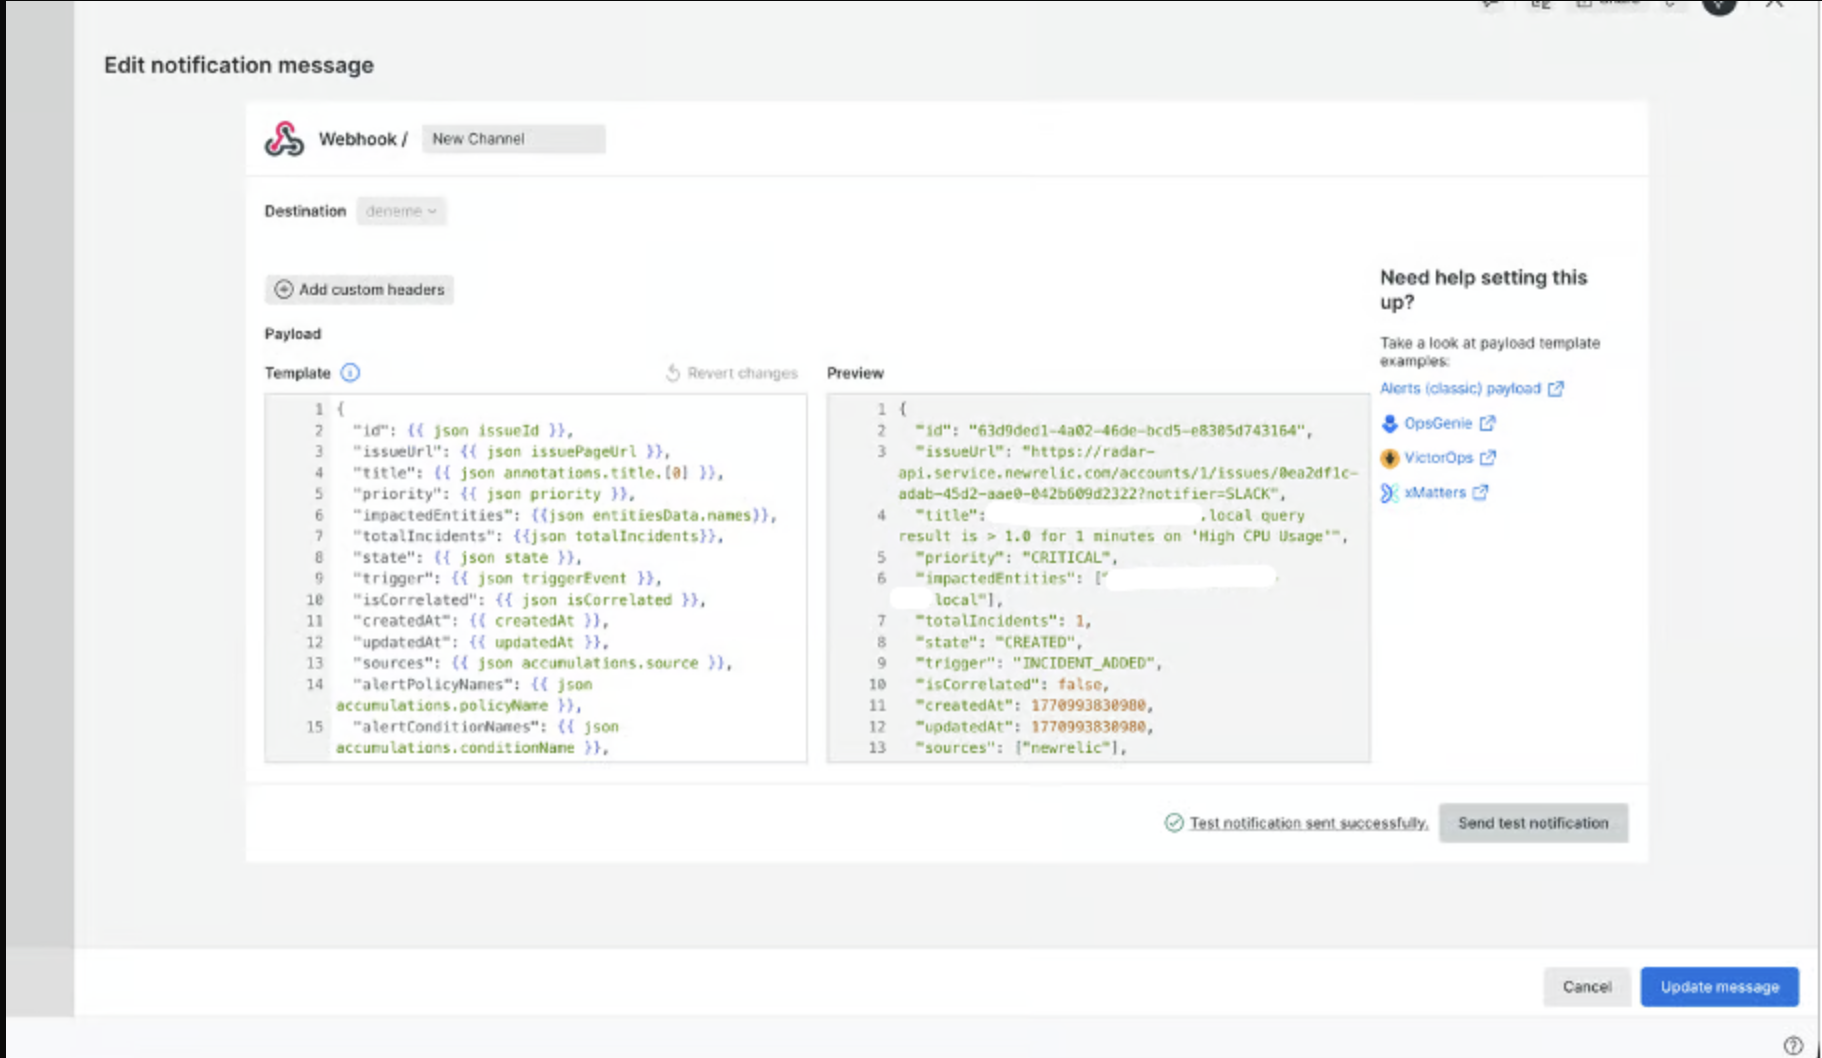
4. Under **Notify**, click **Webhook** to add a notification channel.
5. Select the destination you created in Step 2 (e.g., `OnCall Platform`).
6. Configure the payload template. The default template includes all necessary fields.
— Payload template editor with preview showing real data
7. Click **Update message** to save the payload template.
8. Back on the workflow page, verify the Webhook channel shows **All updates** (this ensures both CREATED and CLOSED notifications are sent).
— Workflow with Webhook channel configured, showing "All updates"
> **Important:** The channel must be set to **All updates** to receive CLOSED (recovery) notifications. Without this, only trigger notifications will be sent.
9. Click **Activate workflow**.
***
### Testing
#### Verify Alert Trigger (CREATED)
Once the alert condition is active, it will automatically trigger when the threshold is breached. You can verify the notifications in two places:
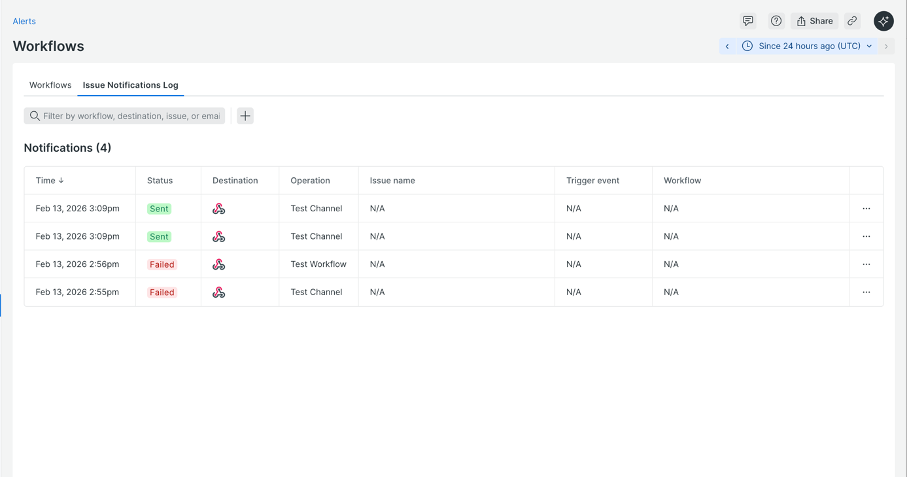
1. **Issue Notifications Log**: Navigate to **Workflows** → **Issue Notifications Log** tab to see sent notifications.
— Issue Notifications Log showing sent notifications
2. **webhook.site**: Check the received payload with `state: "CREATED"` and `trigger: "INCIDENT_ADDED"`.
— CREATED payload at webhook.site with full JSON body
#### Verify Active Issue
Navigate to **Alerts** → **Issues & Activity** to see the active issue with its priority, duration, and entity name.
— Issues & Activity showing Active issue (Critical priority)
#### Verify Recovery (CLOSED)
To test the recovery flow:
1. Go to **Issues & Activity**.
2. Select the active issue (checkbox).
3. Click **Close issues**.
4. Check webhook.site for the CLOSED payload with `state: "CLOSED"` and `trigger: "USER_ACTION"`.
— CLOSED payload at webhook.site
#### Verification Checklist
Verify that:
1. A **CREATED** notification is received by the platform (status: PROBLEM).
2. The payload contains the correct `alertPolicyNames`, `alertConditionNames`, and `priority`.
3. A **CLOSED** notification is received after closing the issue (status: RECOVERY).
4. The `id` field matches between CREATED and CLOSED payloads for proper correlation.
***
### Troubleshooting
| Issue | Possible Cause | Resolution |
| ------------------------------ | ----------------------------------------------- | ------------------------------------------------------------------------------------------- |
| No alerts received | Workflow not activated | Ensure the workflow status is **Active** in the Workflows page |
| No alerts received | Workflow filter doesn't match | Verify the Policy filter matches your alert policy name exactly |
| Recovery alerts missing | Channel not set to "All updates" | Edit the webhook channel in the workflow and ensure notification preference includes closed |
| Payload format unexpected | Custom payload template modified | Revert to the default payload template or verify all required fields are present |
| Authentication error (401/403) | Incorrect webhook URL or token | Verify the endpoint URL and authentication token in the Destination settings |
| Delayed notifications | Evaluation delay or aggregation window too long | Reduce the Window duration and Delay values in the alert condition's signal settings |
| "Failed" in Notifications Log | Destination endpoint unreachable | Check the endpoint URL is accessible and responding with 2xx status codes |
| Duplicate notifications | Multiple workflows matching the same policy | Review Workflows and remove duplicates |
***