# Elastic Integrations
Elastic is a search and observability platform built around Elasticsearch and Kibana. Its built-in alerting engine lets you define rules that evaluate queries on your data at regular intervals. When a rule condition is met, Kibana can fire a webhook action to any HTTP endpoint — including itoc360. This page walks you through setting up that connection.
### How It Works
Kibana rules run on a schedule you define. When the rule condition is met (for example, a query returns more results than a threshold), Kibana calls the webhook connector you have attached to that rule. The connector sends a JSON payload to itoc360, which turns it into an alert in your on-call workflow.
### Prerequisites
* An Elastic Cloud account (any plan with Kibana access)
* An itoc360 account with at least one active on-call schedule
### Step 1 — Open Kibana
Log in to your Elastic Cloud account and open your Kibana deployment. You will land on the Observability overview page.
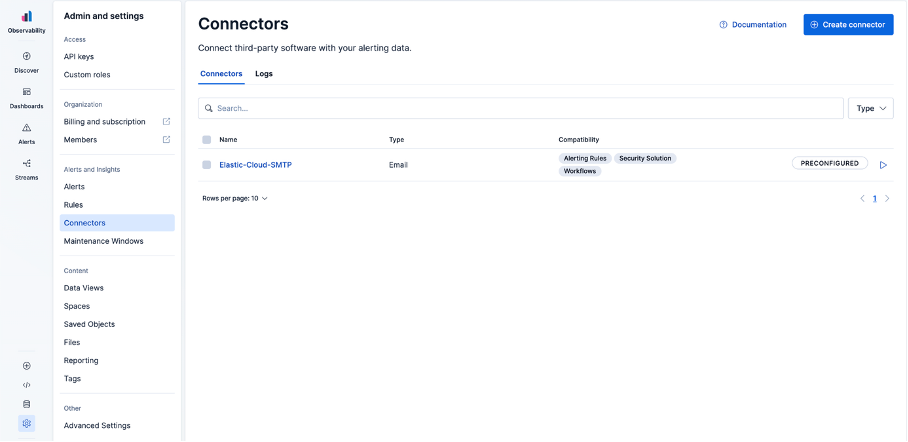
### Step 2 — Create a Webhook Connector
Navigate to **Settings (⚙️) → Connectors** in the left sidebar, then click **Create connector**.
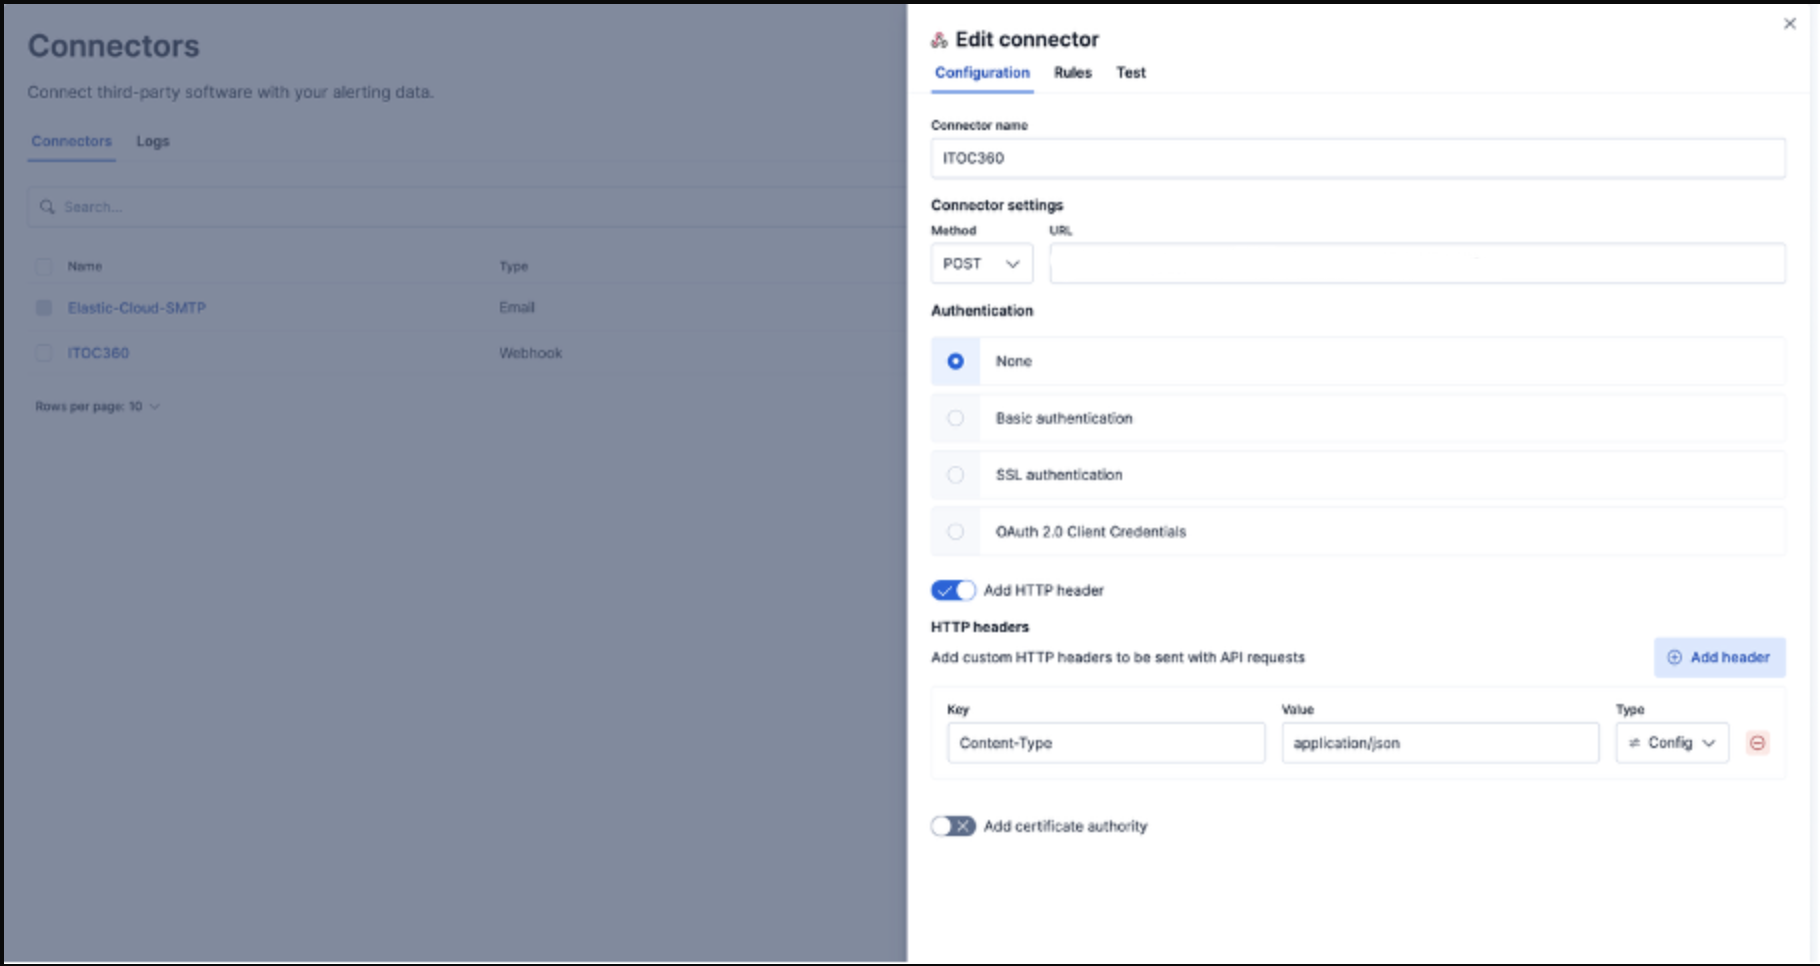
Select **Webhook** from the connector type list. Fill in the connector form with the following values:
| Field | Value |
| ----------------- | ----------------------------- |
| Connector name | `itoc360` |
| Method | POST |
| URL | Your itoc360 webhook endpoint |
| Authentication | None |
| HTTP Header Key | `Content-Type` |
| HTTP Header Value | `application/json` |
Click **Save** to confirm.
### Step 3 — Create an Alerting Rule
Go to **Connectors → Rules** in the left menu and click **Create rule**. From the rule type list, select **Elasticsearch query**.
Configure the rule definition:
* **Query type:** KQL or Lucene
* **Data view:** Select the data view that covers the indices you want to monitor
* **Condition:** Set your threshold (for example, `count() IS ABOVE 0`)
* **Rule schedule:** Every 1 minute (adjust to your needs)
Scroll down to the **Actions** section and click **Add action**. Select **Webhook**, then choose the `itoc360` connector you created in Step 2.
In the action body, paste the following template:
```json
{
"alertId": "{{alertId}}",
"alertName": "{{alertName}}",
"alertActionGroup": "{{alertActionGroup}}",
"alertActionGroupName": "{{alertActionGroupName}}",
"spaceId": "{{spaceId}}",
"date": "{{date}}",
"kibanaBaseUrl": "{{kibanaBaseUrl}}",
"context": {{{context}}}
}
```
Scroll further down, give the rule a name under **Details**, then click **Save rule**.
### Step 4 — Verify the Connection
To confirm that alerts are reaching itoc360, open the connector and go to the **Test** tab. Replace the body with a plain JSON payload (no Mustache variables) and click **Run**.
A `200 OK` response in the Results section means the connection is working. Within the next rule evaluation cycle, a real alert will appear in your itoc360 alert feed.
### Webhook Payload Structure
When a rule fires, Kibana sends a payload that looks like this:
```json
{
"alertId": "abc123",
"alertName": "High Error Rate",
"alertActionGroup": "query matched",
"alertActionGroupName": "Query matched",
"spaceId": "default",
"date": "2026-03-23T17:00:00.000Z",
"kibanaBaseUrl": "https://my-project.kb.europe-west3.gcp.elastic.cloud",
"context": {
"title": "rule 'High Error Rate' matched query",
"message": "rule is active",
"conditions": "count > 0",
"value": "42"
}
}
```
### Troubleshooting
**The connector test returns an error** Double-check that the URL field contains your full itoc360 webhook endpoint and that the `Content-Type: application/json` header is present. Remove any trailing slashes from the URL.
**Rules are firing but no alerts appear in itoc360** Make sure the `itoc360` connector is selected in the **Actions** section of the rule, not just saved at the connector level. Each rule needs its connector explicitly attached.
**The action body looks wrong after saving** Kibana validates Mustache templates at save time. If you see an error, make sure `{{{context}}}` uses triple braces (not double) since it contains a JSON object, and all other variables use double braces.