# Alibaba CloudMonitor Integration
Route threshold-triggered alerts from Alibaba CloudMonitor into itoc360 to automatically open and resolve incidents across your on-call workflow.
### Overview
Alibaba CloudMonitor is the native monitoring and alerting service for Alibaba Cloud resources. It tracks metrics like CPU utilization, memory usage, disk I/O, and network throughput across services such as ECS, RDS, SLB, and more. When a metric crosses a defined threshold, CloudMonitor fires a webhook callback to notify external systems.
The CloudMonitor console gives a centralized view of all active alerts, system events, and resource quota usage across your Alibaba Cloud account.
### Step 1 — Create an Alert Contact
An alert contact holds the destination URL that CloudMonitor will call when an alert fires. In this step, you create a contact that points to your itoc360 source webhook URL.
1. In the CloudMonitor console, expand the **Alerts** section in the left sidebar and click **Alert Contacts**.
2. Switch to the **Alert Contacts** tab and click **+ Create Alert Contact**.
3. Fill in the form:
* **Name** — enter a recognizable label such as `ITOC360`
* **Region for Alert Notification Service** — select the region closest to your infrastructure
* **Slack Webhook (http|https)** — paste the itoc360 source webhook URL, including the token query parameter
* **Language of Alert Notifications** — set to **English**
4. Click **OK** to save. The approval indicator at the bottom of the form will turn green once the webhook URL passes validation.
> **Note:** The webhook URL must be publicly reachable over HTTPS. If you are testing locally, use a tunnel tool such as ngrok first, then swap in your production ITOC360 endpoint when going live.
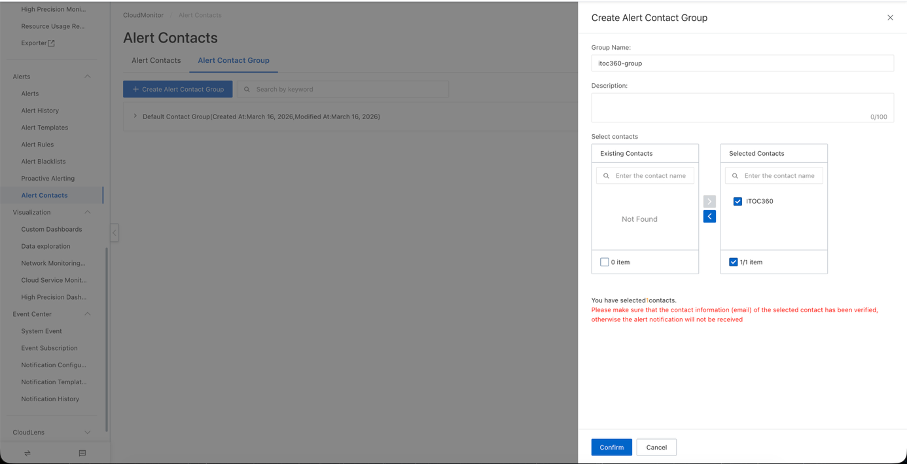
### Step 2 — Create an Alert Contact Group
Alert rules in CloudMonitor do not reference contacts directly — they reference groups. You need to wrap the contact you just created inside a group before it can receive notifications.
1. Still on the Alert Contacts page, click the **Alert Contact Group** tab.
2. Click **+ Create Alert Contact Group**.
3. Set the **Group Name** to something clear, for example `itoc360-group`.
4. In the contact selector on the left, find the contact you created in Step 1 and move it to the **Selected Contacts** column on the right.
5. Click **Confirm** to save the group.\
### Step 3 — Create an Alert Rule
An alert rule defines which metric to watch, the threshold that triggers a notification, and which contact group receives it. It also carries the callback URL that CloudMonitor POSTs the payload to.
1. In the left sidebar, click **Alert Rules**, then click **+ Create Alert Rule**.
2. Set the following fields in the panel:
* **Product** — choose the Alibaba Cloud service you want to monitor, for example `Elastic Compute Service (ECS)`
* **Resource Range** — select **All Resources** to cover every instance, or restrict to specific instances if preferred
* **Rule Description** — click **+ Add Rule** to define the threshold: pick the metric, comparison operator, threshold value, and alert level (Critical, Warn, or Info)
* **Alert Contact Group** — select the group created in Step 2
3. Scroll down to **Advanced Settings** and locate the **Alert Callback** field. Paste the same itoc360 webhook URL here. CloudMonitor will POST the alert payload directly to this URL each time the rule fires.
4. Click **Confirm** to activate the rule.\
> **Note:** Set the **Mute Period** to a value that fits your alert volume. The default 24-hour window means CloudMonitor will not re-notify for the same condition within that period, which helps keep incident noise low.
### Step 4 — Verify the Rule is Active
After saving, the rule appears in the Alert Rules list. The status column should show **Normal** in green, confirming the rule is enabled and CloudMonitor is actively evaluating the metric.
You can trigger a test notification at any time by clicking the **More** menu on the rule row, or by using the **Test** button inside the Alert Callback field when editing the rule. When the test fires, a POST request is sent to the callback URL and the alert should appear in your itoc360 source.
### How Alerts Map to Incidents
itoc360 reads the `alertState` field from the CloudMonitor payload to decide whether to open or resolve an incident:
| CloudMonitor `alertState` | itoc360 Action |
| ------------------------- | ----------------- |
| `ALERT` | Opens incident |
| `OK` | Resolves incident |
| `INSUFFICIENT_DATA` | Opens incident |
When the same rule fires again after recovering, a new incident is opened since the previous one is already closed.
### Priority Mapping
itoc360 uses the `triggerLevel` field to determine incident priority:
| CloudMonitor `triggerLevel` | itoc360 Priority |
| --------------------------- | ---------------- |
| `CRITICAL` | Critical |
| `WARN` | Medium |
| `INFO` | Low |
To customize these mappings per source, go to **Sources → Edit → Priority Mapping**.
### Troubleshooting
**Webhook fires but no incident appears in ITOC360**
Check the Supabase Edge Function logs for validation errors. The most common cause is a missing or misnamed field in the callback payload. Confirm that the Alert Callback URL in the rule matches the URL shown on the ITOC360 source page exactly, including the token query parameter.
**Test button returns a non-200 status**
CloudMonitor sends a GET request to verify the host before the first POST. Make sure your endpoint responds to GET requests with a 200. The itoc360 webhook handles this automatically; if you have a proxy or firewall in front of it, ensure GET traffic is also allowed through.
**Alert fires but the incident never resolves**
Automatic resolution requires CloudMonitor to send a follow-up notification with `alertState` set to `OK` when the metric drops back below threshold. Verify that the alert rule does not have an unusually long Mute Period that would delay the recovery notification.